Services / Method — Boundary Estimation
We make maps from your list.
Give us a geo-referenced file — voters, members, customers — and we hand back accurate, standards-compliant boundaries: precincts, districts, service areas. They are accurate. They are standards-compliant. They work.
01 — The problem
There is no national map of where things actually happen.
Human activity is inherently geographic — it concerns the behaviour of large numbers of people within designated spaces. But there is no single authority producing the spatial data needed to analyse it. Precincts, school districts, utility zones, council wards and service areas are drawn piecemeal by different bodies, on different timelines, with different methods and restrictions.
The result: even with a household-level list and coordinates for every address, you can’t do meaningful geographical analysis, because the boundaries those addresses fall inside simply don’t exist as data. Precinct-level results are a fundamental tool — yet because boundaries are handled differently county to county, there’s no way to analyse them nationally.
02 — From overwhelming to legible
If knowledge is power, raw data is just noise.
Intuitive tools inform action — findings should be legible. Here’s the same eight million Texas voters, three ways.
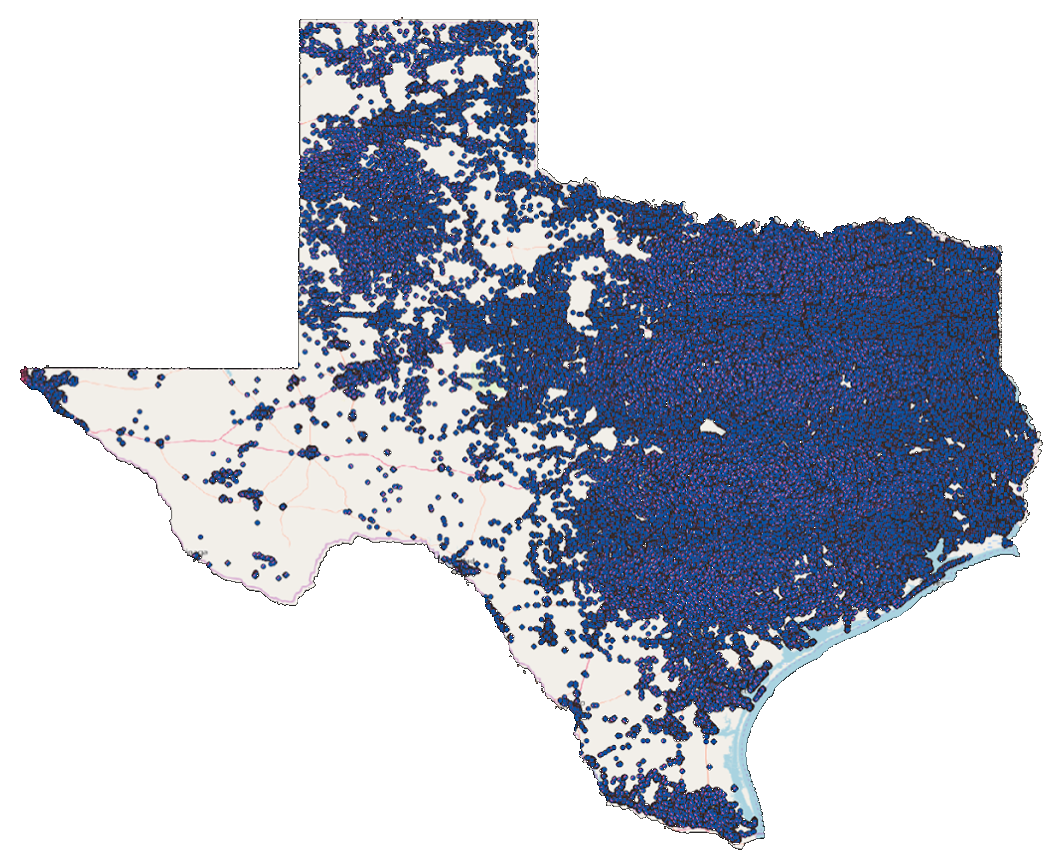
Every voter, plotted
A dot per household. Technically complete, and completely overwhelming — you can’t act on a solid wall of points.
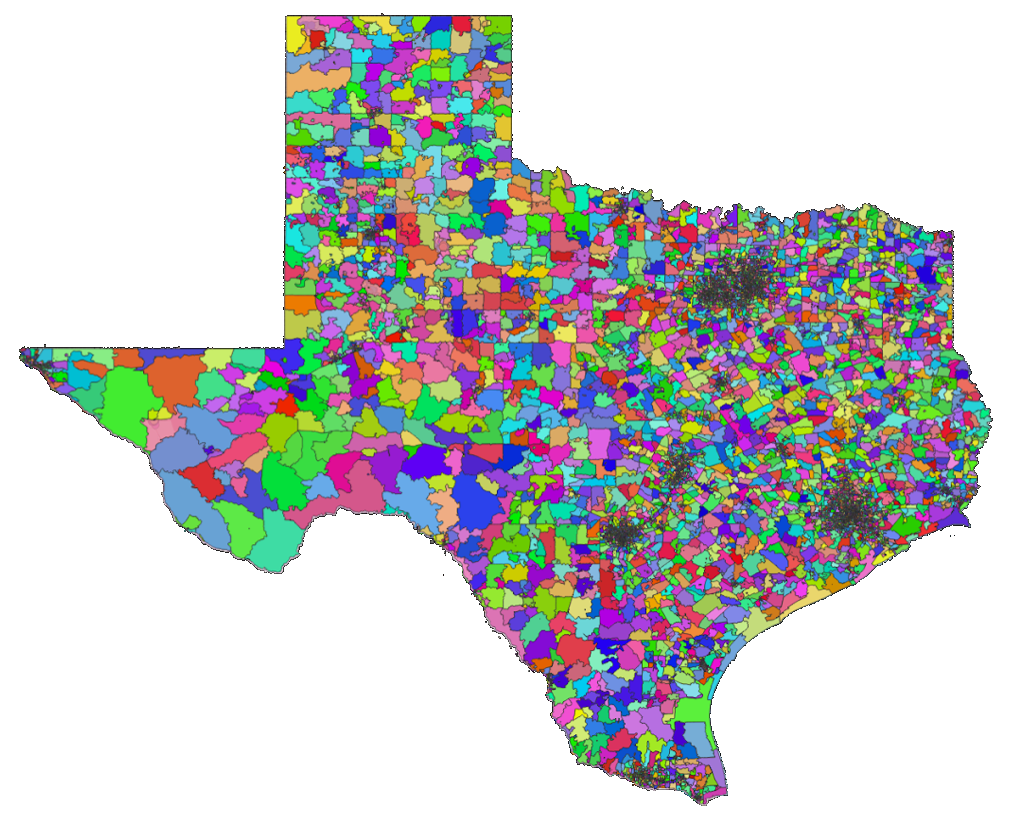
Coloured by precinct
Now it’s confetti. Does this look like a precinct map to you? Colour without boundaries still can’t be read.
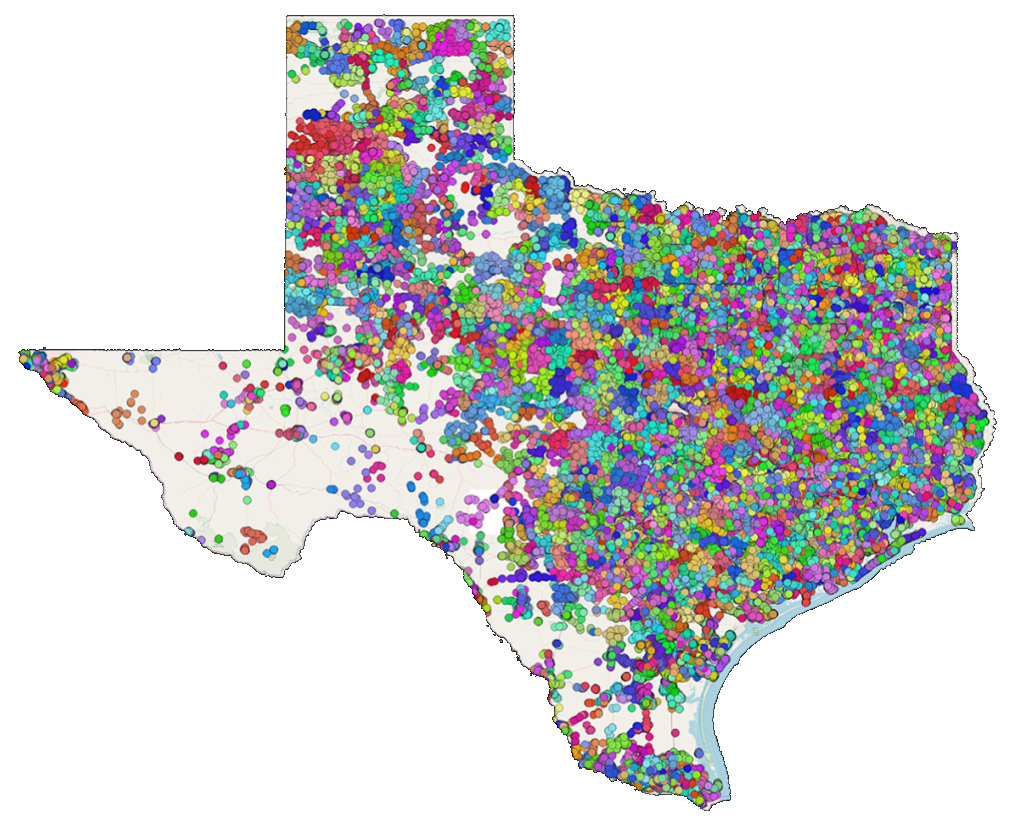
Smart polygons
Every precinct, containing all its voters. Legible, analysable, and ready to drive a decision.
Intuitive
See your people by the boundary that matters — precinct, district, or turf.
Accurate
The moment data is mapped, errors become visible — and fixable.
Empowering
Boundaries unlock a whole new class of derivative tools built on top of them.
The world’s most tedious trigonometry.
The short version: we take a geo-referenced file and estimate each boundary in question, one at a time, using every address field, geographical field and Census reference available. The long version is a lot of very careful geometry — and seven years of refining it.
We build entirely on open-source GIS supported by the Open Source Geospatial Foundation — no proprietary black boxes, no licences you have to rent. The method that estimated a whole state in under seven hours on a laptop now runs nationwide on Apache Sedona.
Do what you do, just better.
Mapping your file immediately raises its accuracy. Errors surface, quality is tracked year on year, and institutional knowledge stops walking out the door.
A foundation for new tools.
Once the boundaries exist, everything built on top of them gets easier. The same polygons power registration, field, redistricting and fundraising work alike.
A whole state, estimated in an afternoon.
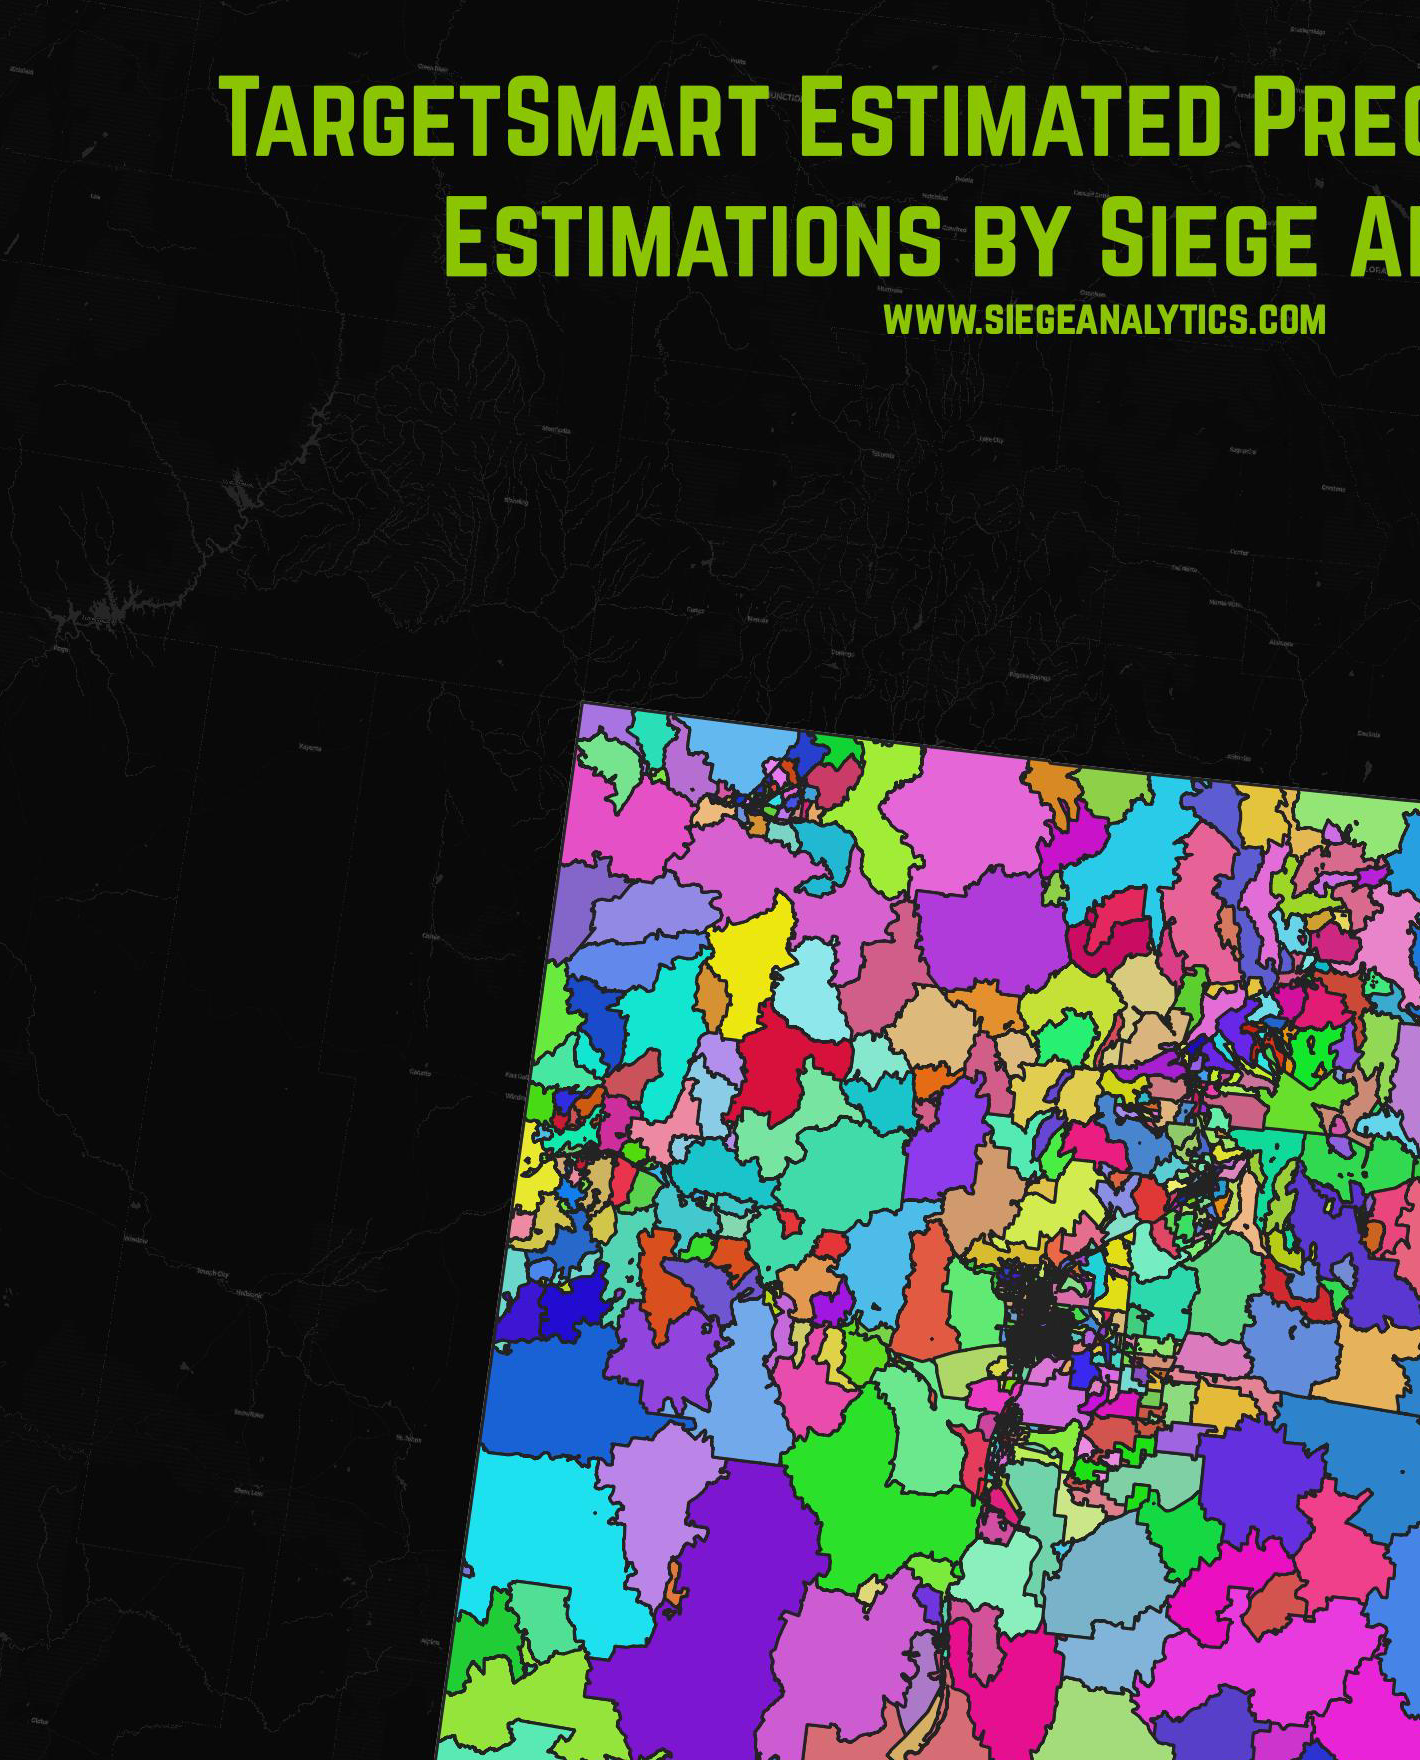
In October 2020 a client handed us a raw TargetSmart voter file for New Mexico — points on a map, no polygons, nothing cleaned. We handed back every precinct in the state as accurate, standards-compliant boundaries.
This is the real output, coloured by precinct code, shown with permission and before any of the geocode hygiene we’d normally apply.
What the boundaries unlock.
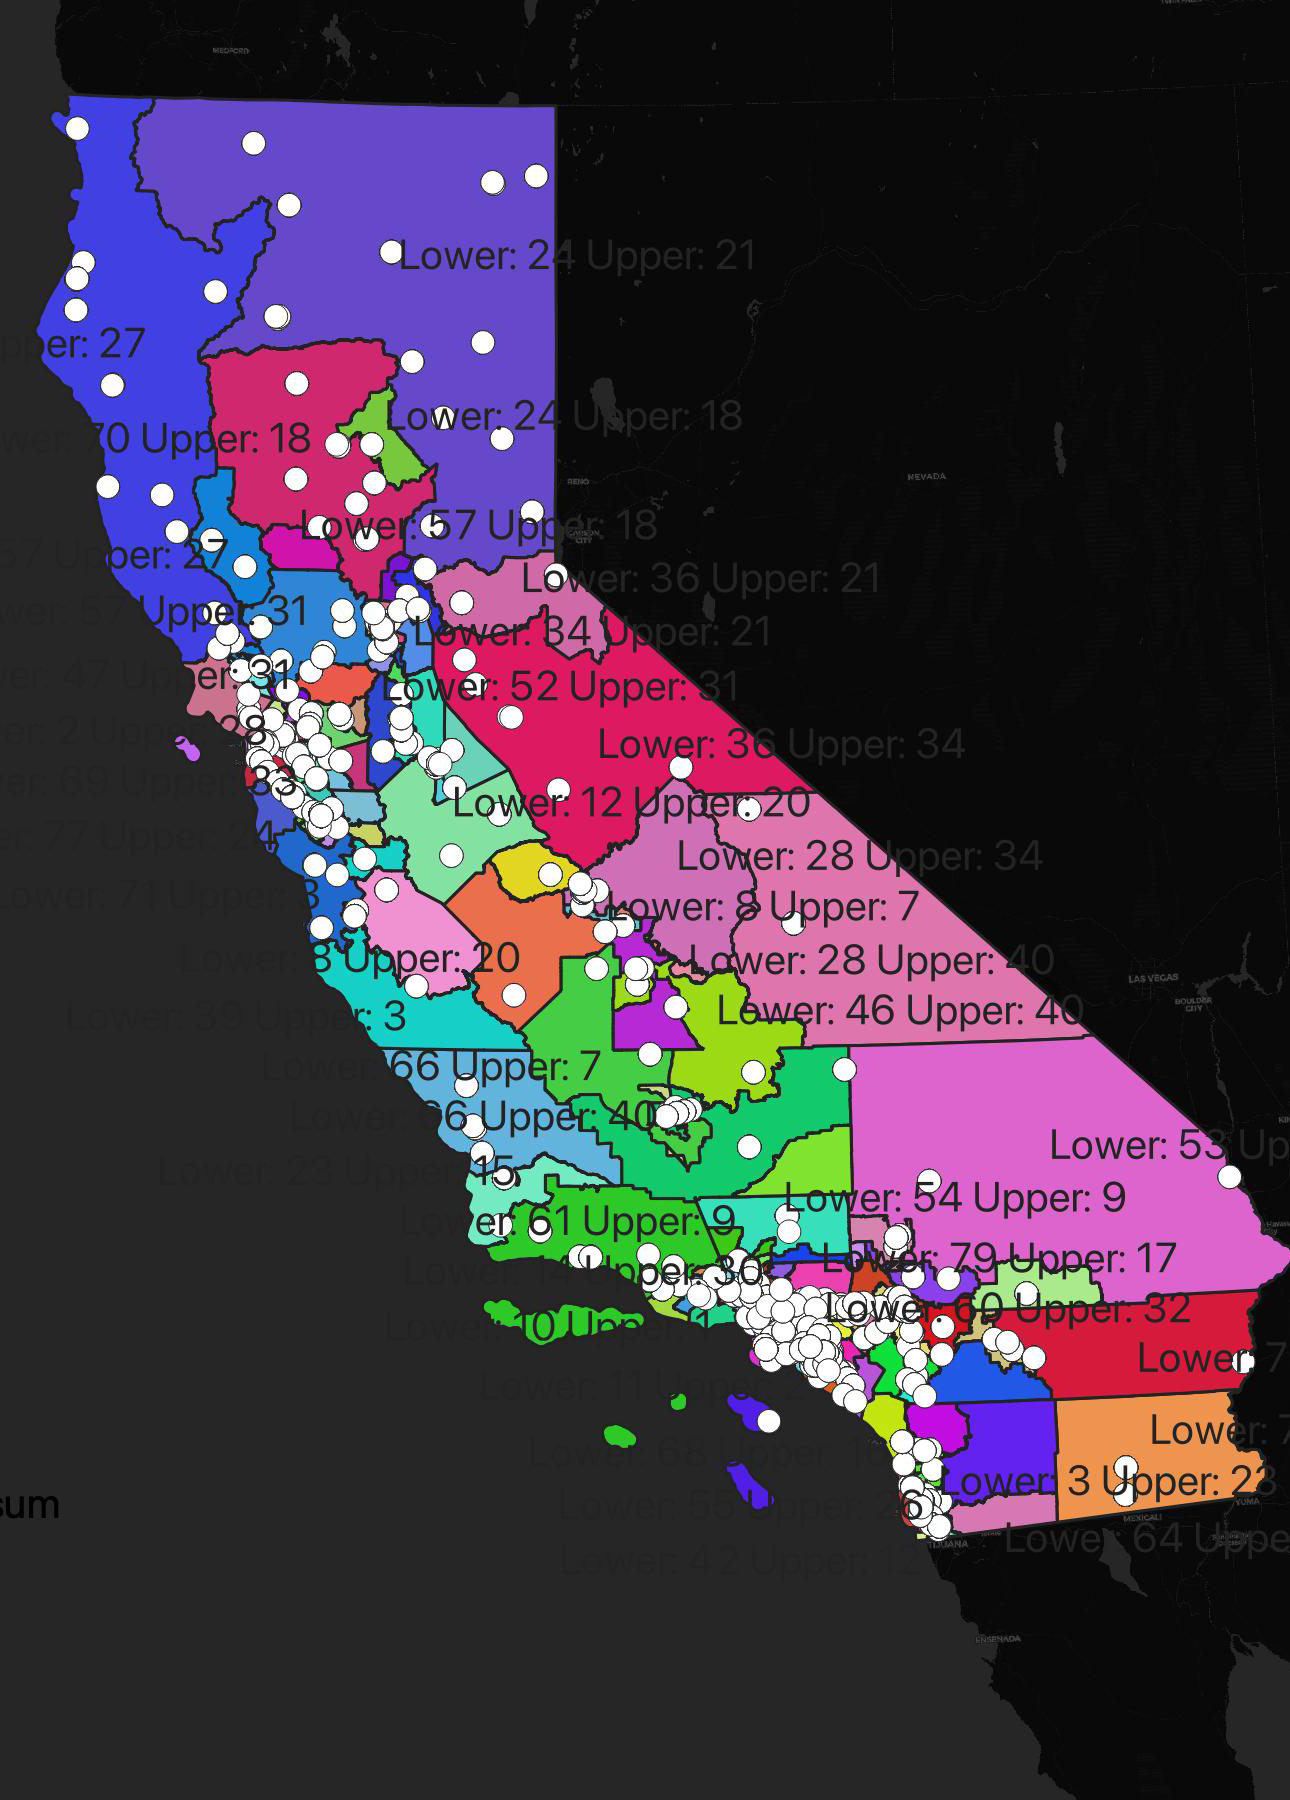
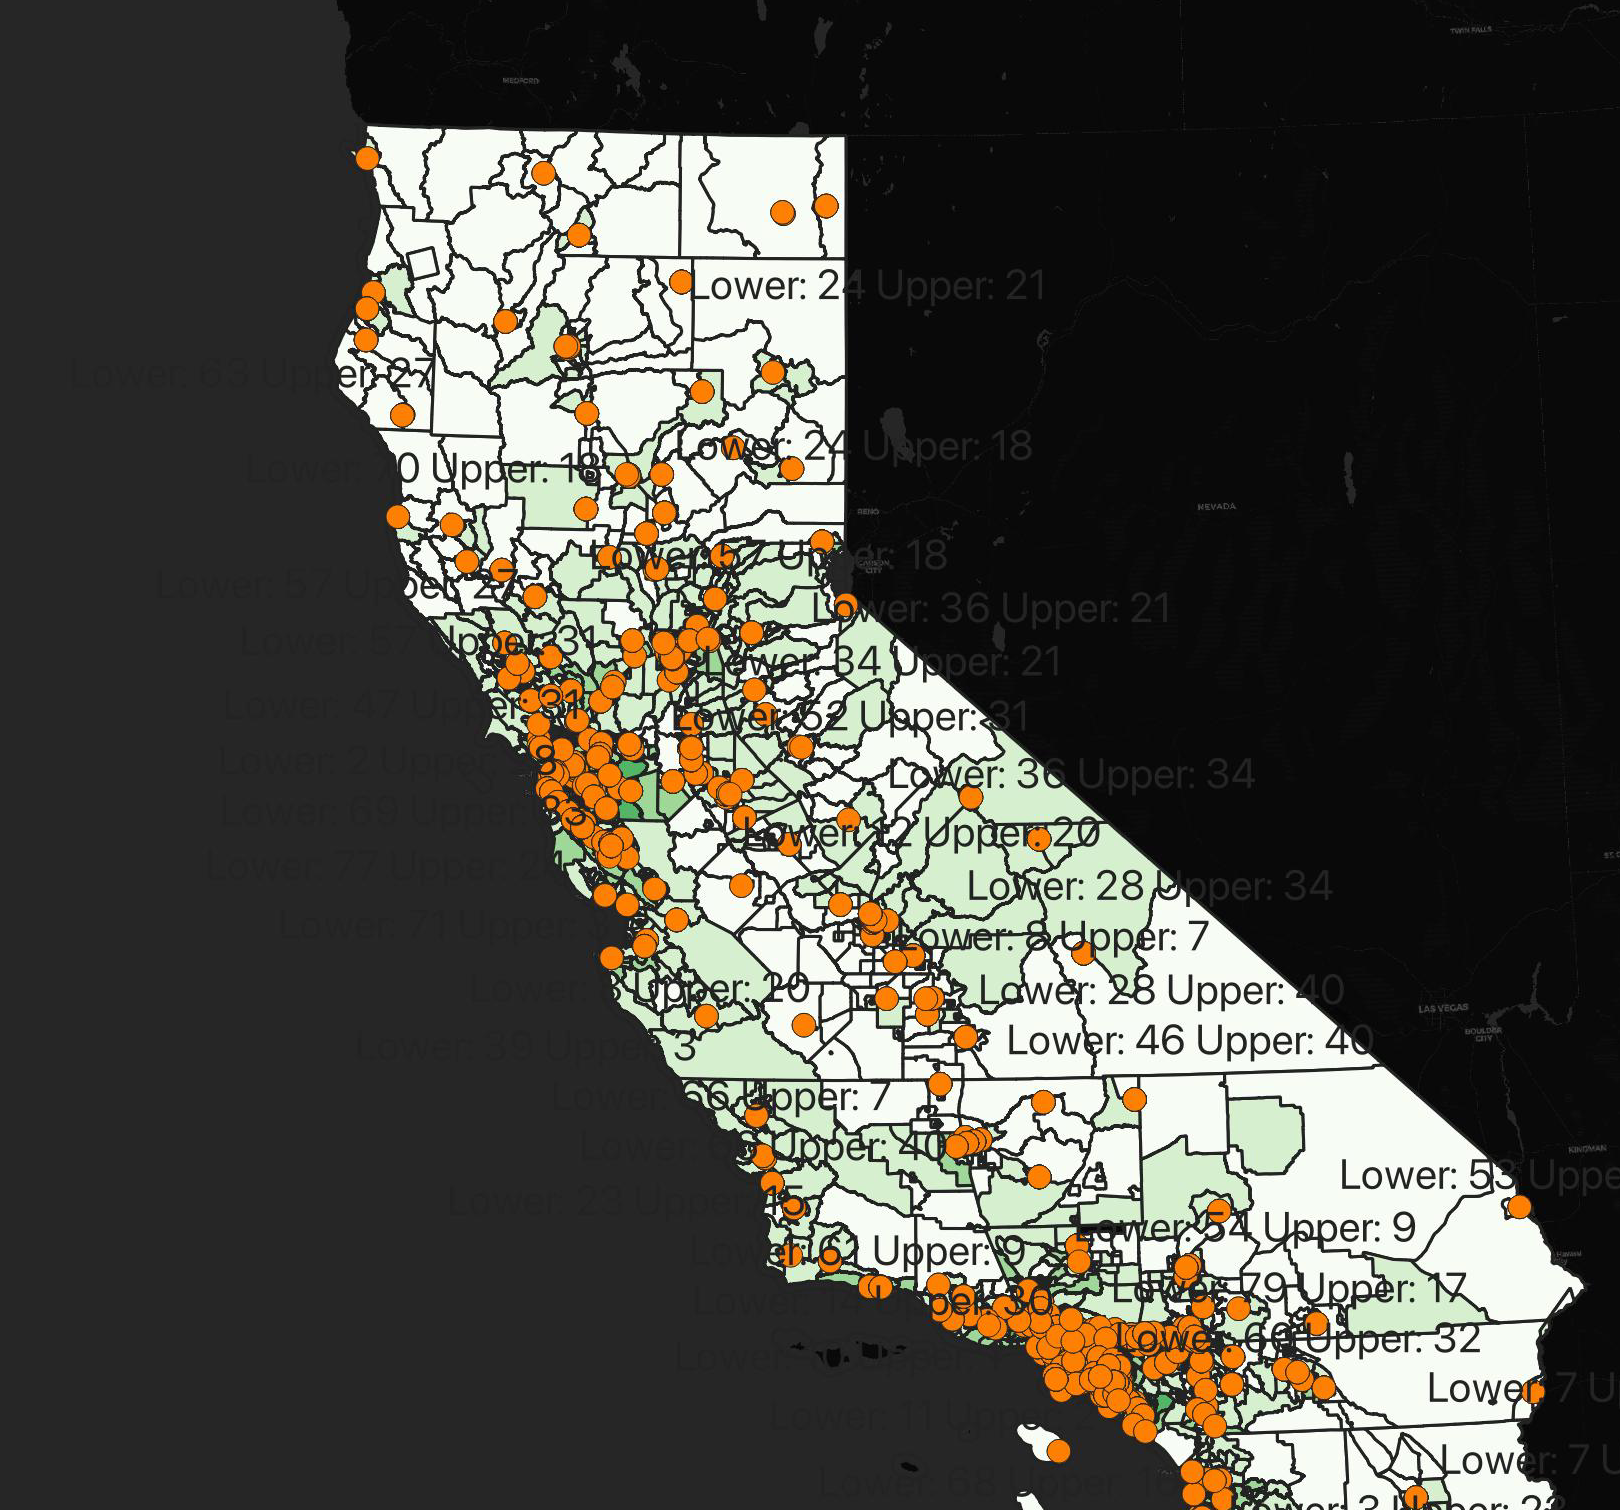
Boundaries are the foundation — everything built on top of them gets easier. As a proof of concept for Mautinoa, we put a public-health question to California: who is responsible for hospital access, and where does that responsibility get shared?
We intersected three public datasets — 2020 California hospital building locations, the 2019 Census State Assembly districts, and the 2019 State Senate districts. Every polygon is one unique Assembly x Senate combination; every white point is a hospital.
Overlay median household income and the gaps surface on sight. In Los Angeles County, Assembly District 10 holds almost no hospitals — the few it has cluster where it shares land with Senate District 39.
Also in the field
Boundaries we’ve built, already at work.
Political Data, Inc.
We supply every boundary PDI uses — from precinct-level election analysis through to their DMP and CRM platforms.
Beto for Senate, 2018
Dheeraj donated precinct shapefiles to the 2018 Texas Senate bid — fuel for an unprecedented decentralisation of field.
NAACP
Regional precinct files, redistricting analysis, and spatial analysis of chapter distribution across Delaware and Rhode Island.
New Virginia Majority
Precinct shapefiles and redistricting analysis supporting organising across Virginia.
Center for Popular Democracy
Precinct files supplied to power organising and electoral analysis across their national network.
The Movement Cooperative
Precinct files supplied to TMC for shared use across their member organisations’ data and analytics work.
Hillary for America, 2016
We donated our precincts to the 2016 presidential campaign, feeding targeting and field operations nationwide.
Working Families Party
Precinct files supporting electoral strategy and field organising across their state chapters.
Start here